01 Live-service simulation · CHPC
Downtown Data Center
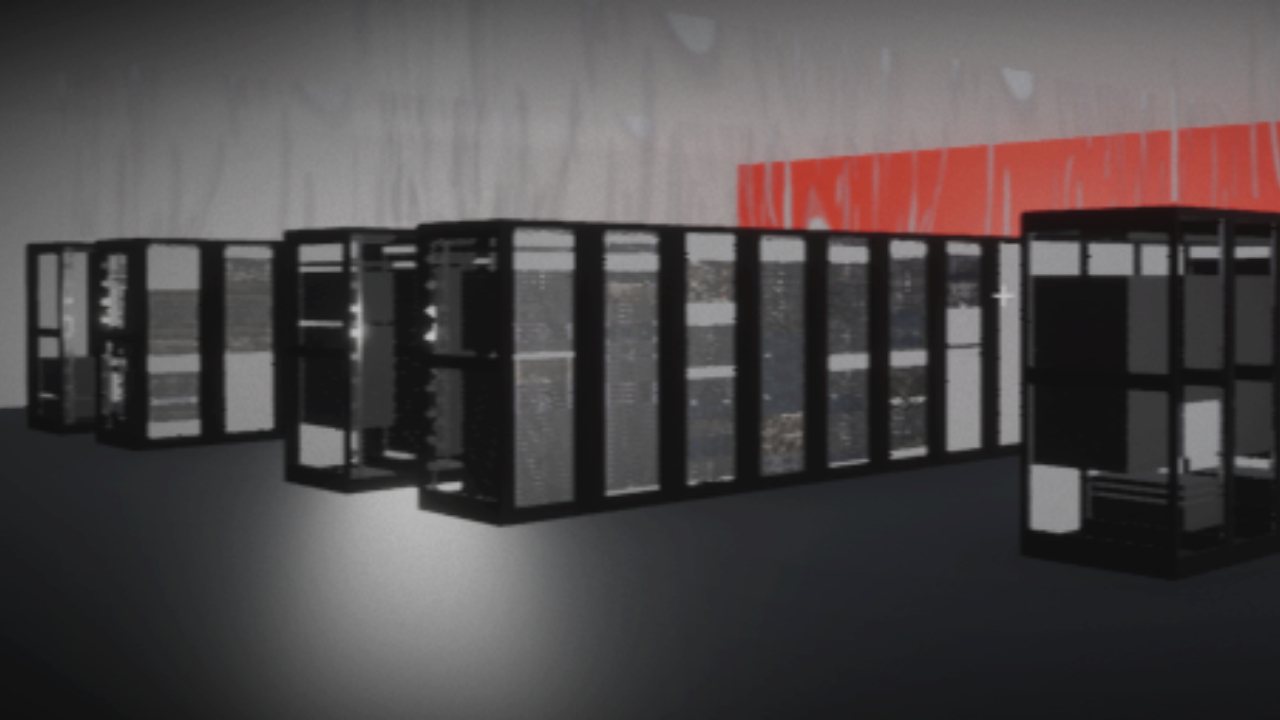
A low-poly, high-readability virtual twin of the University of Utah's downtown data center. Technicians used it for remote monitoring, debugging and training, and it streams to the browser, so there's nothing to download.
- Role
- Game Designer (Generalist) · official title Graphic Software Developer
- Team
- Two-person core team · CHPC, University of Utah
- Timeline
- Dec 2023 – Jul 2026 (full time and on site from May 2025)
- Built with
- Unreal Engine 5.3 · Maya · Pixel Streaming
Internal use only. The simulation holds sensitive infrastructure data, so there's no public build; this deck shows recordings and screenshots.
02 The question
How do you turn real-time infrastructure data into a usable 3D interface?
- ProblemChecking racks, alerts and jobs relied on physical methods that slowed staff down.
- DesignA low-poly, alert-first space: loud alerts, lit server fronts and a clear sensor-data UI.
- SystemOne data table spawns 200+ servers, SQL pipelines feed inventory and rack data, and Pixel Streaming delivers it in the browser.
- UserI surveyed staff, mapped the areas they rely on most, and folded volunteer testers' feedback into releases.
- ResultTechnicians used it for remote monitoring, debugging and training. Internal use only.
I owned
- User research and requirements.
- 200+ server models in Maya and the data-table spawning system.
- UI and UX for the sensor data.
- Engine moves (5.3 to 4.23 and back) and Pixel Streaming on Linux.
- Pipeline documentation and onboarding.
I worked with
- One other developer: a two-person core team.
- Engineering, for the rack-mapping data and inventory portal.
- Data center staff, as users and volunteer testers.
Internal use only: the simulation holds sensitive infrastructure data, so there is no public build.
03 Watch
Two builds, about eight months apart
A walkthrough from September 2024 and one from May 2025.
04 User
A tool, not a replica
The goal wasn't a photorealistic copy of the data center. It was a clear, functional tool that staff would actually use instead of falling back on older, physical methods.
- Surveyed staff on the metrics they track and how they look for information, then mirrored that in the simulation.
- Mapped the physical data center and prioritized the areas staff rely on most.
- Watched where physical methods slowed people down: clutter, poor visibility, and hard-to-spot alerts.
- I observed user sessions and collected usage data to fix bugs in the live build.
Clarity through design
- Low-poly environment to cut visual noise and keep performance high.
- Clear UI/UX built around the end user and iterated on feedback.
- Visually loud alerts that stand out even across the room.
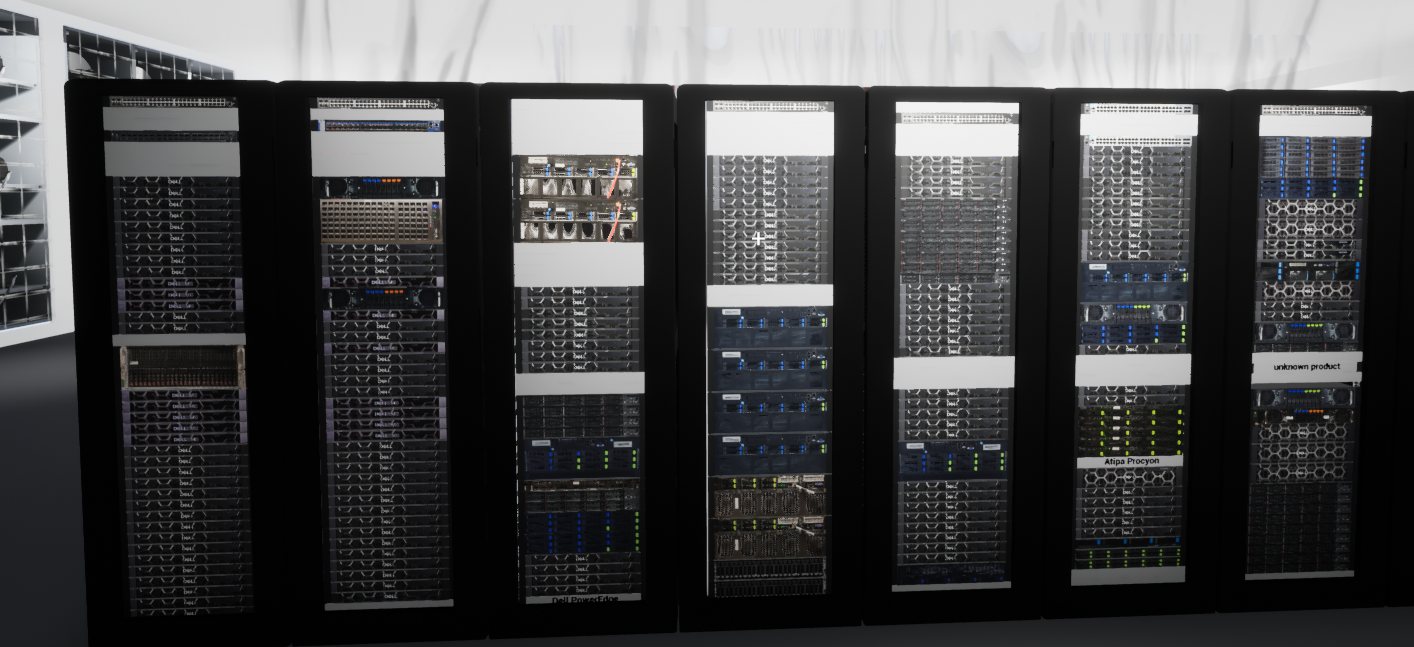
- Purposeful lighting that highlights server fronts for quick recognition.
- Browser delivery so access works on any OS with no installs.
05 System · Data pipeline
200+ servers, spawned from data
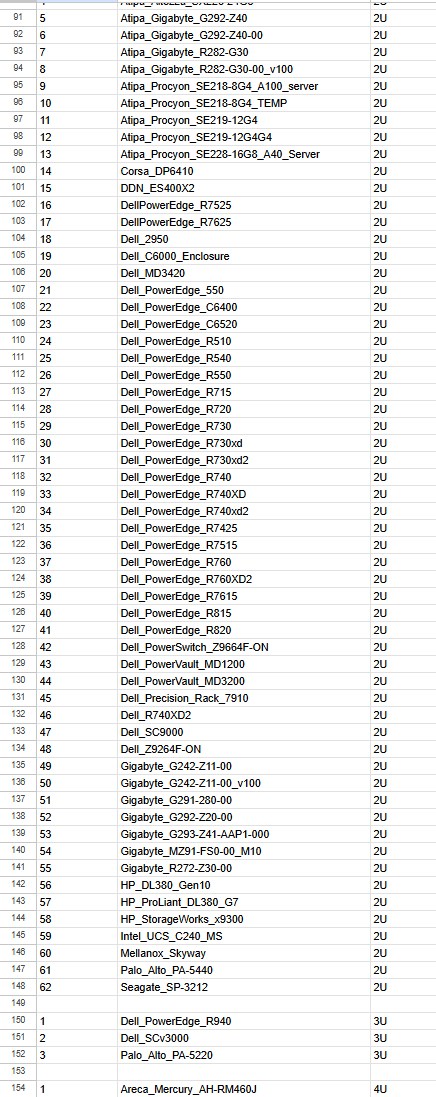
Every server model has its own front-panel texture, sourced from online research and on-site reference photos, and is scaled to real-world dimensions from the inventory team.
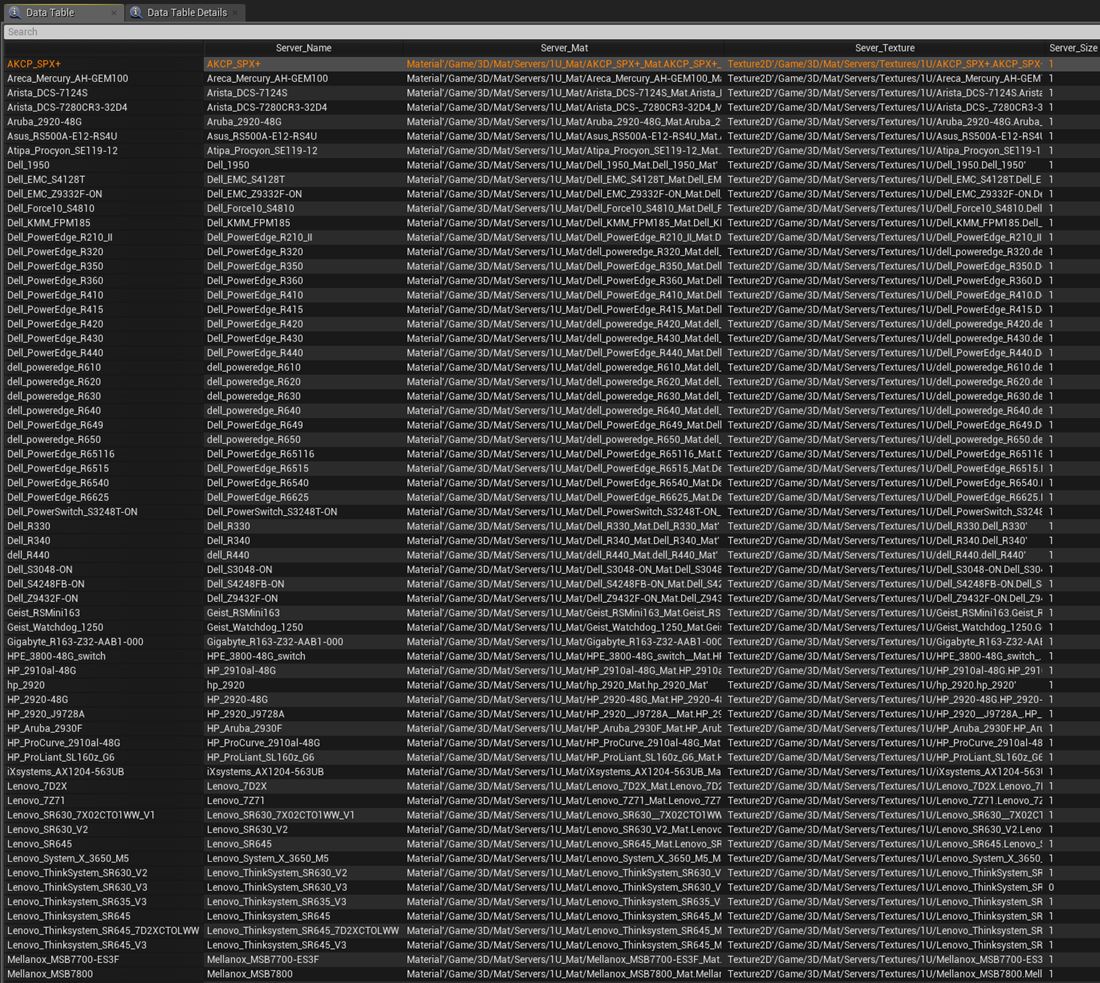
I replaced 200+ one-off server Blueprints with a single data-table-driven spawning system keyed on name, texture, material and size, structured to cut RAM use. SQL pipelines feed inventory and rack data into the simulation, and a plain-language guide lets new team members add servers on their own.
06 Design · UI / UX
Sensor data you can read at a glance
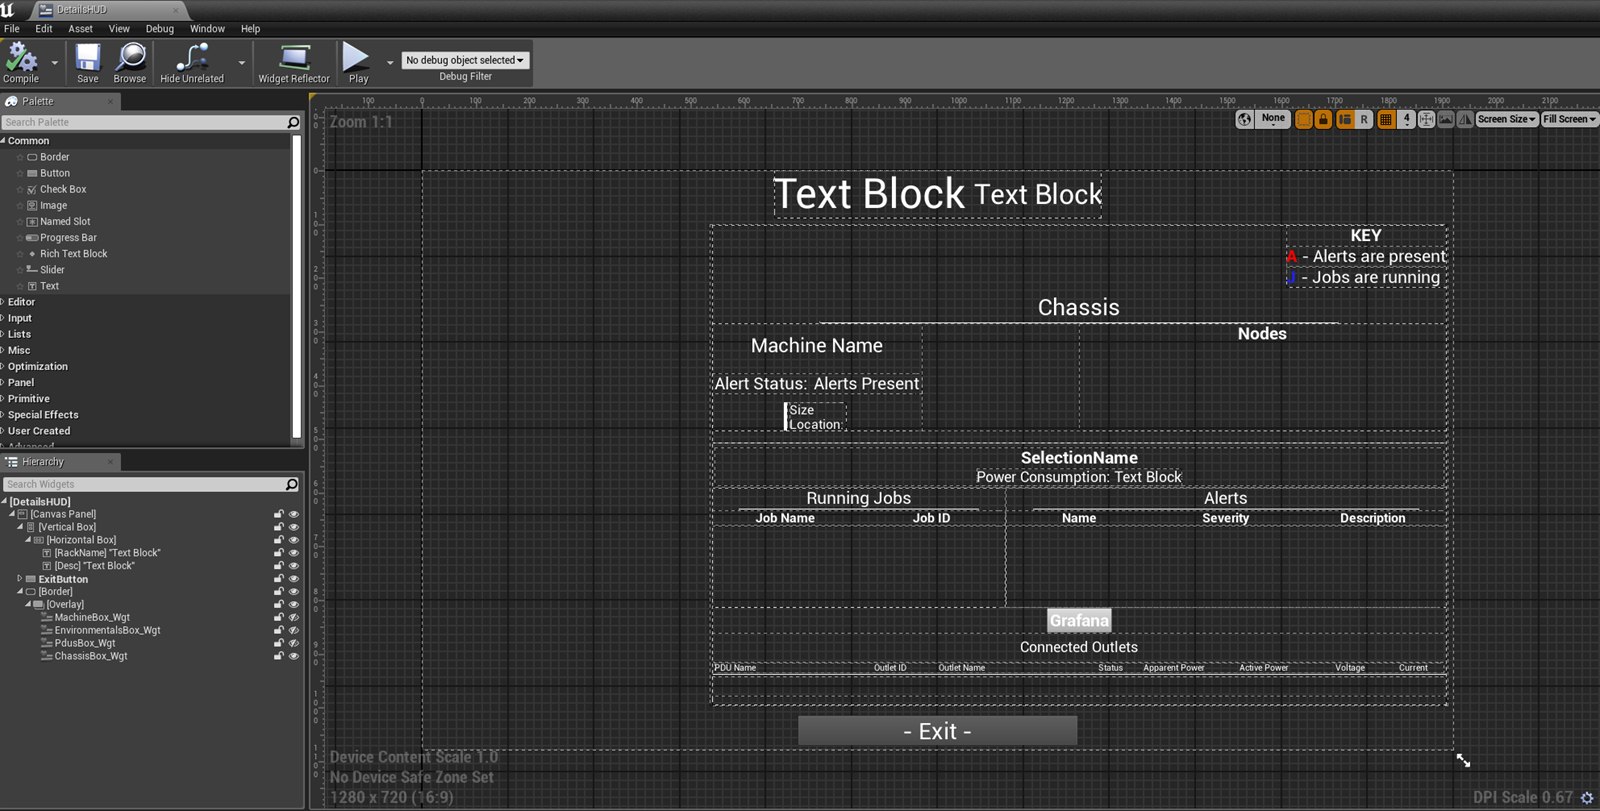
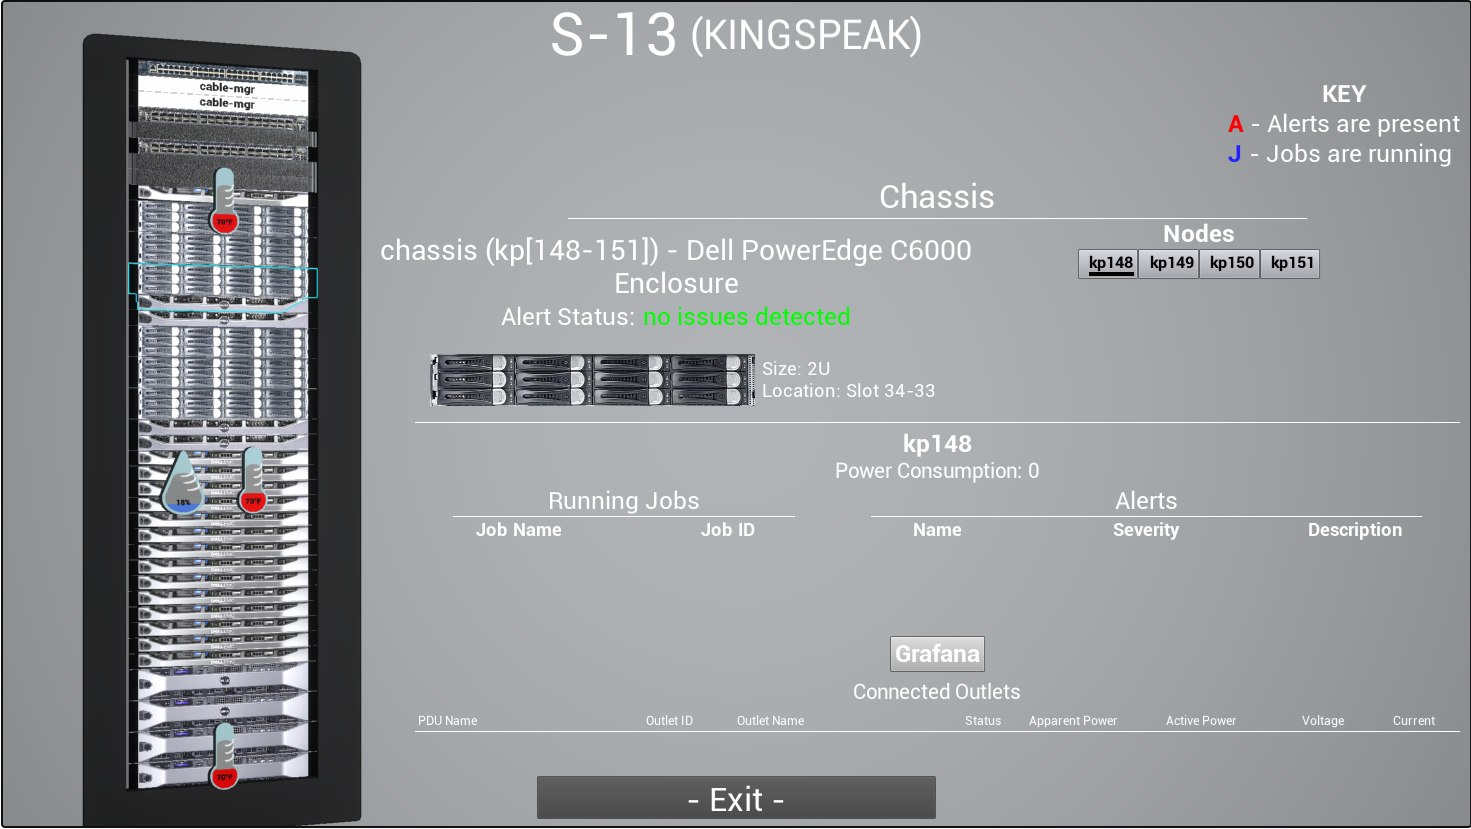
Clicking a rack opens its details: the chassis and nodes, alert status, running jobs, power use and connected outlets, with a color key for alerts and jobs.
07 System · Deployment
Getting it into a browser, on any OS
Technicians shouldn't have to install anything. After evaluating NVIDIA WebGPU, HTML5 export and Pixel Streaming, the project took three engine and platform moves.
-
Start
UE 5.3
The simulation began in Unreal Engine 5.3.
-
HTML5 release
UE 4.23
I led the migration: moved assets, optimized scenes and built supporting Blueprints to ship an internal HTML5 build.
-
Final setup
UE 5.3 + Pixel Streaming
Back on 5.3, streaming from a dedicated Linux server once that path proved more scalable.
Multi-instance
Architected two isolated Pixel Streaming instances on separate ports on Windows.
Linux
Migrated the build to Rocky Linux 9, cross-compiling with Clang 16.0.6 and fixing the compiler and toolchain errors that came with it. I wrote C++ for the cross-platform deployment.
Prototype
An AR overlay in UE 5.4 that shows rack data when staff point a phone at a physical rack.
08 Creation process
From site visits to a scalable pipeline
-
Research
Mapped workflows & users
- Reused assets from an earlier 3D touring project to move faster.
- Surveyed staff and mapped the areas they rely on most.
-
Core systems
Assets & data
- Modelled 200+ low-poly servers and pods in Maya to precise measurements, down to screw points.
- Tested the engineering team's rack-mapping data and caught overlaps and mismatches with the floor.
-
Expansion
Usability & delivery
- Presented to the department, recruited testers and folded their feedback into releases.
- Designed UI for sensor data across several areas of the simulation.
-
Scale
Docs, polish, mentoring
- Wrote pipeline documentation for onboarding, and I mentored new team members.
- Fixed UV issues and added models for environmental detail.